 English | EN
 SYNTHETIC TABULAR DATA FOR TESTING YOUR APPLICATIONS
June 12, 2023

Introduction
We live in a time where data privacy is becoming increasingly important. For many companies, privacy regulations such as the GDPR cause setbacks. Frequently, the news covers stories on companies not being able to comply with these data regulations and getting major fines. As a data scientist, I often see examples of companies that have collected a lot of data, but regulations restrict them to use this data for innovation purposes. A breakthrough in deep learning led to the emergence of a new generation of synthetic data generators. In 2015, Ian Goodfellow introduced the Generative Adversarial Network (GAN). The new generation of data generators leverages the power of GANs to learn the characteristics of data. One field of application is tabular data. This blog dives into the generation of tabular data and how to scale from synthetic Excel sheets to synthetic databases. Additionally, this blog provides you with a little behind the scenes of our own service ADA. Hopefully, this blog can help identify possibilities for synthetic data and help you understand the current limitations of the field.
The definition of synthetic data
If you are a frequent reader of the monthly Sogeti Data blogs, you might have come across the term synthetic data more than once. But what is it? Synthetic data is artificially created data that, mathematically and statistically, matches real-world data. So basically a machine-made mirror image of the original data. Synthetic data can be used to train machine learning models with substitute data instead of using original data. All of this without a loss in performance and with the option to increase the volume of a given dataset to possibly increase its performance. A great opportunity for synthetic data lays within the field of testing because it is often hard to create realistic test data manually and regulations, rightly so, restrict the usage of real data. However, in practice real data is often still used for testing. Last month, a malicious attacker got access to the test environment of T-Mobile and because they were using real data as test data, 50 million consumer records were leaked.
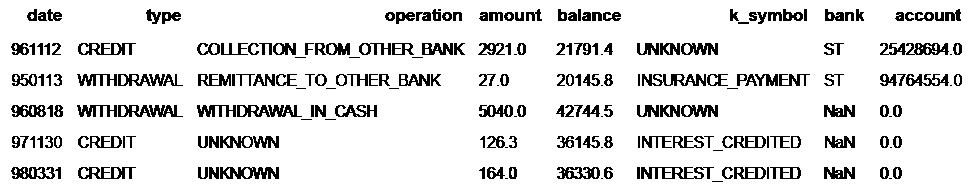
In the blog about next-level data augmentation, synthetic data for computer vision is discussed. However, synthetic data is not limited to image data. Synthetic data can be generated for all data types. In literature, the two most popular synthetic data types are images and tabular data. The latter is displayed in figure 1 and is the main data type covered in this blog.
The technology behind it
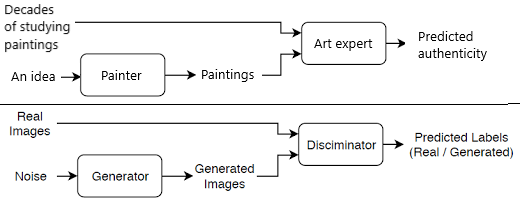
So what are these Generative Adversarial Networks (GANs) that are behind this synthetic variant? A GAN is a collection of neural networks that learn the distribution of a dataset implicitly, with trial and error. Let’s use an analogy to explain a GAN: Imagine someone who is new to painting but who wants to be able to reproduce van Gogh’s painting style. With this skill, he/she can create new paintings worth millions. To improve upon his painting style, he/she needs an art expert that knows what a van Gogh looks like. Initially, the paintings that the painter produces will be easily distinguishable from a van Gogh but over time, with feedback from the art expert, the painter will be able to create new, improved paintings, aimed to match a painting style similar to that of van Gogh[1]. Eventually, after years of practice, the painter could end up creating a painting that fools the art expert.
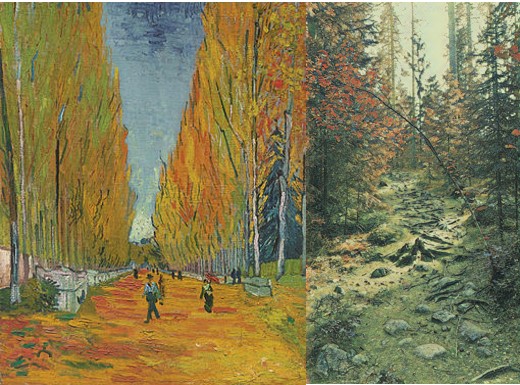
Fig 2: on the left, you can see a real van Gogh painting. In the middle, a self-captured photograph is displayed. On the right, a painting, which is generated by a GAN, is displayed. CycleGAN is used to generate this example.
Now let us go back from painting van Goghs to understanding what a GAN is. Let us assume we want to utilize a GAN for generating realistic van Gogh paintings. The GAN consists of two deep neural networks. The first network is called the generator. This network can be seen as the painter in the analogy. The generator is responsible for generating new paintings. The second network is called the discriminator. The discriminator has a similar function as the art expert. This network tries to classify a painting as real or fake. The magic of the GAN occurs during training because the generator and discriminator networks are trained simultaneously. During training, the generator tries to fool the discriminator by generating realistic paintings. In turn, the discriminator tries to outsmart the generator. Additionally, a random mix of real and fake paintings is presented to the discriminator. This helps the network to correctly distinguish between real and fake paintings. The discriminator also provides the generator network with feedback so it can learn from wrongly generated paintings. The information flow of the training is displayed in figure 2. At the end of this training ‘game’, in an ideal situation, the discriminator has learned what the characteristics of a van Gogh painting are but yet it is getting fooled in many cases by the paintings generated by the generator network. The generator network can now be utilized separately from the discriminator network to generate realistic van Gogh paintings that fool art experts in the wild.
Applying GANs for synthetic data generation
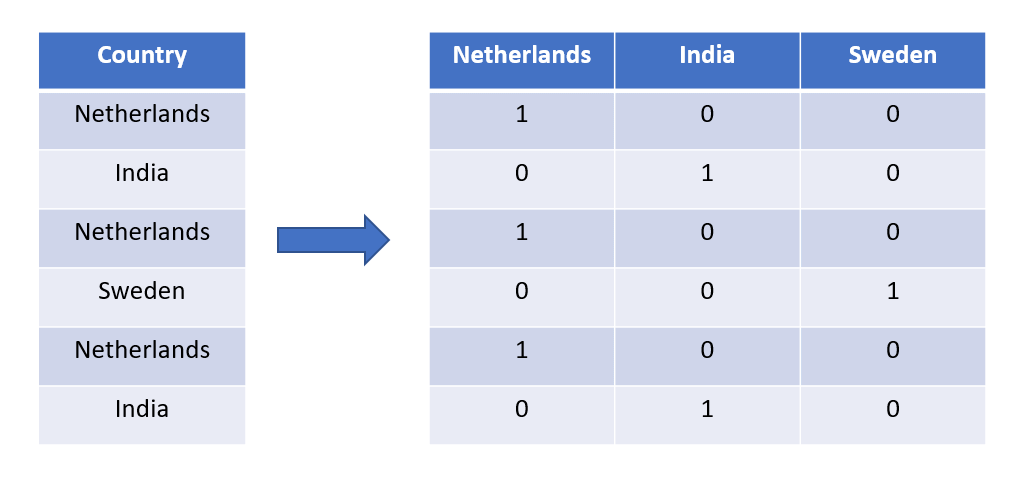
Now let us jump back from utilizing Generative Adversarial Networks to generate van Gogh paintings to generate synthetic tabular data. Tabular data is very different from an image but learning information from image data is very similar to learning information from tabular data. An important aspect of tabular data processing is transforming the data in a way it is usable for the GAN. This is very dependent on the specific use case, however, a basic example is converting categories into numbers. This is required because GANs for tabular data only handle numerical values (see figure 4). Another example is converting dates to continuous variables to ensure that dates are treated as sequences and not categories. Furthermore, there are a lot of different steps that could be taken before the GAN can be trained, but after the suitable pre-processing steps are taken, the data is ready for training. In most synthetic data projects, sufficient preprocessing of the data takes up the most time. Similar to the process of learning characteristics from van Gogh paintings, the GAN can learn the characteristics of any dataset. The generator generates table rows and the discriminator tries to predict if the row is real or fake. After training the GAN, the result is a generator network that can generate realistic but synthetic table rows.
Scaling from a single table to an application landscape
Generating synthetic tables sounds pretty straightforward if you know how the GAN functions, right? However, not many companies will have databases with only one table (I hope). Now we hit the biggest limitation of synthetic tabular data because it is very hard to maintain relational integrity between (distant) tables. The majority of the research is centered around single-table synthetic data but this is not very useful for many companies. Luckily, there are some methods to maintain relational integrity (partially sometimes) and the best approach is again very dependent on the data and the use case. With very small datasets it is possible to merge everything until you are left with a single table. The GAN can then be trained with this table and generate new data. Afterward, the previously merged tables are pulled apart until a collection of separate tables remains. Using this approach, the size of the merged tables will grow very fast and for medium and large datasets this means that it will overflow the memory. Applying the same principle to a bigger collection of tables often results in the creation of hubs that consist of a collection of tables that are very dependent on each other. This approach can lead to losing relational information between hubs but these can be captured with appropriate post-processing. Another method is using a hierarchical approach where the master tables are generated first and information of the master table is passed to the child tables and their information is passed again to their children tables until there are no children left. The downside of this approach is that its complexity makes it slow to train and generate data.
One detail that is often misconceived by customers is the generation of database metadata. To merge tables, it is crucial to know which primary-foreign key connections are present. In some databases, this information is recorded, however, in some databases, it is not. Often these relationships are defined in the application and this makes it hard to recover them, with limited knowledge about the application. Of course, there are some tools to help discover these relationships but nevertheless, a lot of work is required to identify the correct relationships.
The advantage of synthetic test data over manually generated test data
After reading this blog you could be wondering if it is really necessary to use fancy neural networks to create test data. Isn’t it much easier to let the developers or testers of an application create test data manually? Yes, that would be much easier! However, this would still take a couple of days to accomplish and in the end, you would have a static test dataset of maybe a hundred records. For every new test scenario, the creators need to spend a couple of hours again to create a test dataset of sufficient quality. When using a GAN to generate synthetic test data thousands of realistic records can be generated for every imaginable test scenario within the blink of an eye. Furthermore, a GAN is able to learn statistical relationships between columns in tables and between tables in such a way that a lot of real-life test cases can be learned instantly. These can be relationships that can only be found by test data creators when doing extensive analysis of the real data before creating the test data. By using synthetic test data to test applications, many working days of developers and testers can be spent on more useful tasks.
Conclusion
In this blog, you learned that synthetic data can have all shapes and sizes. I hope to have also taught you the concept of the technology behind the latest generation of synthetic data generators, the Generative Adversarial Network, and what makes the GAN so suitable for generating synthetic data. Additionally, I hope you have learned how we use this technology at Sogeti to generate taular data with ADA. ADA is an in-house developed GAN that uses a combination of the aforementioned techniques to generate real-world test data for an application landscape.
Bonus material
In 1715, the Night Watch of painter Rembrandt van Rijn was trimmed on all sides to make it fit into its new location, the Amsterdam Town Hall. The trimmed pieces of canvas got lost over time which made it impossible to correctly reconstruct the painting. Anno 2021, the missing pieces of the Night Watch were reconstructed by an ensemble of neural networks that learned the colors and brush strokes of Rembrandt. The reconstructed pieces were concatenated with the Night Watch painting and it is now displayed in the Rijksmuseum in its original size.

About the author