Before we dive deeper into the Bayesian method check out our previous blogs of the series for a quick recap:
Why R is an ideal framework for working with stats
How we can reduce Big Data preparation from 6 months to one week with R
How R makes it possible to inject easily images, videos, sounds or other kinds of data
In science, statistics can be problematic. And sometimes, this can reach judicial errors and even irremediable dramas. So, let us be specific. Since 2012, certain scientific fields such as social and pharmacological sciences have been facing a crisis of confidence. This is caused by the fact that many results cannot be replicated.
The question that now comes to mind is to know the root causes of this crisis. In this article, we will set aside those related to bad statistical practices used in a significant part of the scientific literature such as “cherry picking”, “publication biases” or “optional stopping”, as they will be the subject of other blogs soon available.
In this article, we will focus on the problem of not using a precise alternative hypothesis in statistical tests. We will see that the Bayesian method takes this criticism into account and that it is easily usable with R and other software.
The problem of the non-specificity of the alternative hypothesis can be vividly illustrated by the real and dramatic British case of Sally Clark.
In 1996, Sally Clark lost her first child to a sudden infant death syndrome (SIDS). In 1997, the unthinkable reproduces and she lost her second child for the same reason.
As a result of this series of sad events, Sally Clark was prosecuted and sentenced to prison for murdering her two children. The reason for this sentence was that the jury was convinced by the argument of pediatrician J. Meadow which consisted of asserting that S. Clark was guilty since the odds that two children died of SIDS in the same family was one against 73 million. After 3 years in prison, S. Clark was acquitted and released, but she dies sometime later as a result of alcohol poisoning.
Speaking about the S. Clark case, the president of the Royal Statistical Society said in 2002 that the jury should have compared two alternative hypotheses; Although the likelihood of two children dying in the same family was very low when considered alone (1/73,000,000), the incidence of a mother killing her two children is even more unlikely.
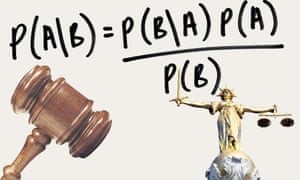
It is here that Bayes’ formula can be useful since it takes this alternative into account as a priori. This a priori is, in fact, equal to the odds that a random person killed his two children. These odds were estimated at 1/500,000,000.
Let’s look at the use of statistical in S. Clark’s imprisonment:
Null hypothesis: S. Clark’s children died naturally (one chance in 73 million).
Vs
Alternative Hypothesis: S. Clark’s children did not die naturally.
Note that the odds of S. Clark being innocent are so low that it was not considered to be likely by the jury.
If we use the formula of Bayes considering a precise alternative hypothesis as a priori, this gives:

In other words, S. Clark’s odds of innocence was equal to 87%. This sad injustice shows us that using a precise alternative, rather than a null hypothesis: hence the interest of Bayesian statistics.
Some statisticians and scientists have understood the value of this type of statistics for this and many other reasons. In fact, we are currently seeing more and more scientific papers using Bayesian analysis to test data.
However, the statistical programs usually used to make it difficult, if not impossible, to apply this method. It is here that R comes to our rescue with packages such as «Bayesiantools», «bayesplot» or «Bayesfactor». It should be noted, however, that this requires some mastery of R as well as a good theoretical knowledge of Bayesian statistics. There are other open source softwares such as JASP and JAMOVI which also use the R-code, but which have a simpler interface to understand as well as a community of users who are always ready to help. It should be noted that JAMOVI also offers access to the code that is generated in R in order to understand the code that underpins the analyses. In other words, it is a very good tool for learning, as well as decisive help for science and justice.
This blog has been co-authored by Kamel Abid and Paul Majerus.

Paul Majerus is a Data analyst – Statistician at Sogeti Luxembourg.

 English | EN
