 English | EN
“Spot the differences” in our childhood, we all have played this game. Remember how much time it takes for us to identify missing objects? 3 – 5 mins, am I right?
Trust me “spot the differences” is not just a game but it is one of the major activities in multiple industries like FMCG, Advertising, design industries. They have dedicated staff that compare graphics/ design/ Artwork for compliance.
This blog is dedicated to showcase the value that AI has demonstrated in this area.
We at Sogeti have delivered this for one of the FMCG giant of USA.
Problem statement:
FMCG client have 60k product SKUs broadly divided by product categories and regions. Artwork or product packaging design is created for each product variant and its sizes. These designs then go through compliance checks. Compliance check includes – regulatory compliances like various icons, non-regulatory compliance like brand logo, product design, etc for their colour, dimensions, position, and text. There is a dedicated team which keeps validating these artworks. These new artwork generation is a very regular process and constantly need compliance checks. Compliance checks and validations are done in 3 ways (referred as use cases) as explained below:
Use case 1: Products designs are created by creative team as Templates and then based on these templates, final art files are created. These final arts need to be verified against templates. Any differences are highlighted based some conditions. Some of the differences are expected like Barcode so they need to highlight on image differently.
Use case 2: Each product will have different variants and different sizes. Such variations in single products are called line-ups. These line-ups need to be compared with each other for each graphical element for following:
- Positional differences- same element is present at same place in all product files.
- Size differences – same element is present in all product files are of same size
- Colour differences – same element is present in all product files are of same colour
- Text content difference – content of the text in all product files is same
- Any missing graphical elements or any extra elements – any design element is present in 1 file and missing in another
Use case 3: These products are also compared with their predecessor artworks to understand major differences. The major challenge is to understand each graphical element for e.g., Brand logo is changed, the solution should still be able to identify old logo and new logo and do comparison. Or new product variant is launched, solution be able to understand which all graphical elements are present even though it is new. These differences were to be highlighted for:
- Any missing or additional graphical elements
- Significant position and size differences
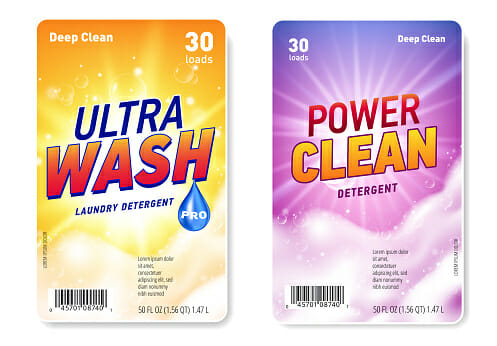
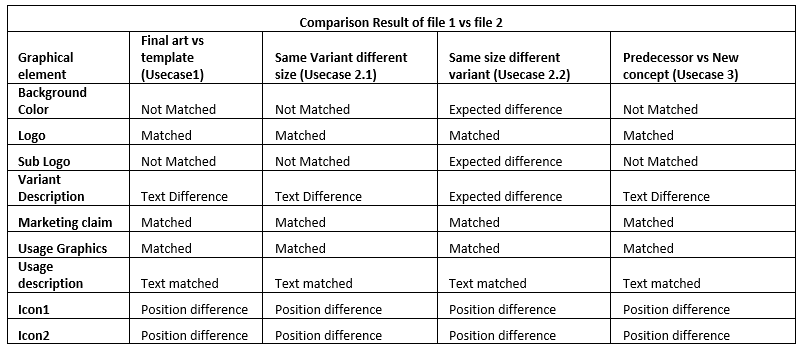
Refer to sample graphics and its results for better understanding
High level solution approach
Above mentioned all three use cases are implemented on three products brands. We architected this as AI solution hosted on Azure cloud. Being AI solution, data is key to it. Data in this case are packaging graphics files. Packaging graphics file are PDF files which have multiple layers in it. These layers club together form the design of entire packet like product logo, product brand name, background graphics, text on packaging. Everything that we see on any product package is graphics. We need to do lot of comparison between each graphical element like brand logo in file vs brand logo in file 2, or text under instructions sections in file 1 vs the text under instruction section in file 2 and so on. It is crucial for us the capture each graphical element and train the deep learning model with its most variations so that I can identify given any graphical file passed to it. Client has provided very limited data; it was a challenge to find all the graphical elements train AI model. Some graphical elements were present in abundance, and some were very less. We faced challenge in making balanced dataset. In AI world getting good quality and balanced dataset can be a game changer. We managed to augment the data set by using different techniques and developed the solution with that. Below are some high-level steps involved in the solution building.
- Get training data for each product and graphical elements.
- Augment images to increase dataset
- Convert PDF to images and do selective compression for performance
- Pre-process these converted data to standardize them and reduce file size for performance optimization.
- Understand and identify each graphical element
- Train object detection model for nearly 40-50 graphical elements.
- For use case 1 –
- Normalize and pre-process all images in comparison to same size.
- Perform similarity check
- Identify each graphical element using object detection in images
- Highlight object which have differences based on criteria
- For use case 2
- Pre-process images
- Identify each graphical element using object detection in images
- Find position of each object in their file and compare for position difference, keeping some acceptable threshold. Same object can be present multiple times in graphics. Therefore, objects with same position are taken as baseline to identify which object to consider for comparison. E.g., brand logo can be present multiple times.
- After objects are found at acceptable position then they considered as right product and then compared for size. As graphical files can be of different size so as thus their graphical elements. Their relative sizes are compared.
- In case of same variant comparison –
- variant graphics will be same so each graphical element should be same in design but can be different in sizes and positioning. If relative sizes are matched, then those elements are compared for key features to find if object is an exact match.
- If position, size and features matched then the graphical element is compliant else highlight that as discrepant, missing or extra.
- In case of same size comparisons-
- Variant will be different; therefore, we need to find that variant information is present at right place and of right size. Object detections model is trained such that each graphical elements is comprised of all these variants under one object. Ex. Suppose a product variant is lavender and another product variant is rose. So, both rose and lavender graphics elements were trained under 1 object as variant graphics.
- Based on position and size these objects are marked as compliant or discrepant, missing or extra.
- In this another ask is text comparison for colour, position, and its content.
- Already identified elements are marked to avoid unwanted text from logo for other graphical elements.
- Over the masked image, we applied OCR for text extraction and applied logic to make big text regions to compare right section of text in graphical file.
- Each text region is again compared for position and size to find exactly which text region between files need to be compared for text and colour.
- After identifying matching text region, its text is compared with certain threshold for acceptance.
- Also, colour match is done using complex logic and ML algorithm of finding sets of dominant colours and comparing them.
- Based on above check the text region is marked as matching or discrepant, missing or extra.
- Use case 3:
- Each object is identified using object detection and compared for their relative position and sizes. Also, text regions detection is done using above mentioned approach. This has higher degree of threshold.
- A UI was created to enable users to upload pdf files, compare them based on use cases and check the results in real time.
Value this solution delivered:
- Quick comparison of graphics. Manually this comparison takes hours for single set. Now with this it can be done within few seconds.
- Small difference like minor text differences or graphics size differences which are very difficult for human eye to catch. Also, manually checking them will require special tools and still they are prone to manual errors. But with this solution they are easily highlighted.
- Comparing more than 2 files in one go. For manual it is very difficult to compare and inference difference between more than 2 files at same time.
- Easy viewing of results any time and even results are available in JSON format which can be integrated in any downstream application for further processing.
- This can be automated to run 24X7 without human interventions
- This can be scaled to new products in minimum time and as a 1-time activity for each product whereas in manual checks, multiple staffs need to be trained for new product graphics and different graphical elements information.
This is high level summary. This solution has potential to revolutionize the graphics and design industries. Even this opens door to solve more such problems that has been existing from long.
Please watch out this space for its part -2 where I will cover technical details, architecture, challenges, and their solution.
Please let me know in comments if you want me to cover any specific area or detail, I will try to bring that up in next part of this blog.