 English | EN
 PREDICTEAP: AN ACCELERATOR FOR ASSET FAILURE PREDICTIONS
July 8, 2019

Industries incur
huge costs for maintenance of their assets, be it fixed assets like
compressors, etc or mobile assets like trucks, etc. This is because scheduled/preventive
maintenance is still prevailing across many sectors. On the other hand,
breakdowns/unplanned shutdowns also lead to further production losses, costing
manifold compared to the cost of the failed component itself.
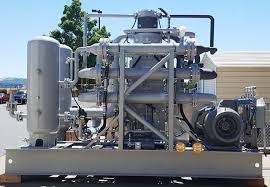

Examples of fixed and mobile assets: Industrial Compressor (Left, Courtesy: RixIndustries); Heavy-duty Truck (Right, Courtesy: Freightliner)
The Engineering
Analytics team of Capgemini DEMS (Digital Engineering and Manufacturing
Services), developed an accelerator, PredictEAP, which computes asset health
score and predicts its failure well in advance by computing its RUL (Remaining Useful
Life) and as well prescribes relevant advisory to the operators for necessary
action to minimize the impact.
PredictEAP is a cloud-based analytics framework for asset health prognostics. It is a containerized solution, deployable on public or private cloud. The framework enables condition-based asset maintenance and production scheduling. It is developed using reusable components and pluggable modules. This framework is technology agnostic and has the ability to integrate with market leading platforms such as Amazon Web Services, Microsoft Azure, and popular open-source libraries in R/Python.
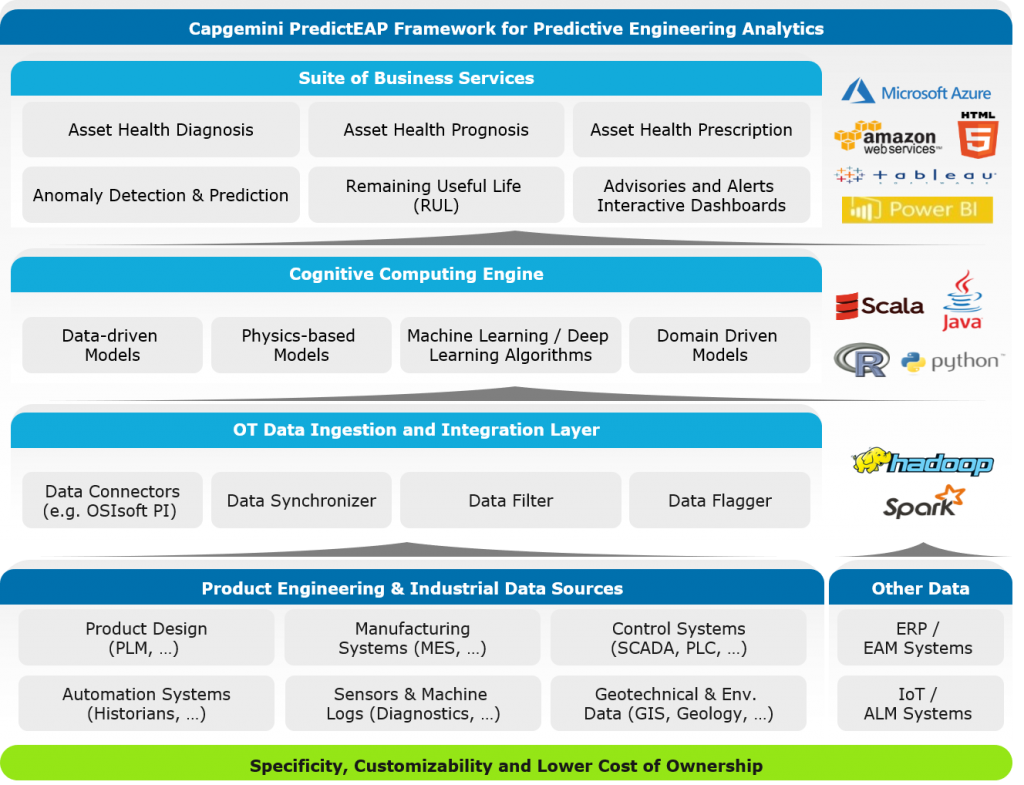
PredictEAP Reference Architecture
The multi-tier
view of PredictEAP framework, shows framework insights, right from data sources
layer which constitutes Sensors, Historian, Machines logs or PLM data, or it could
be coming from Asset life cycle management or Enterprise asset management
systems.
The next layer
is OT Data ingestion and integration layer, where custom scripts or self-tools
such as Apache SQOOP and Azure data factory are used for data ingestion and
data pre-processing where most of the data cleaning is done. The next layer is
the cognitive computing engine comprising of prediction models, be it fully
data-driven or a hybrid model also involving physics as well as expertise of
domain consultants. The top layer shows the business solution suite where use
cases are implemented.
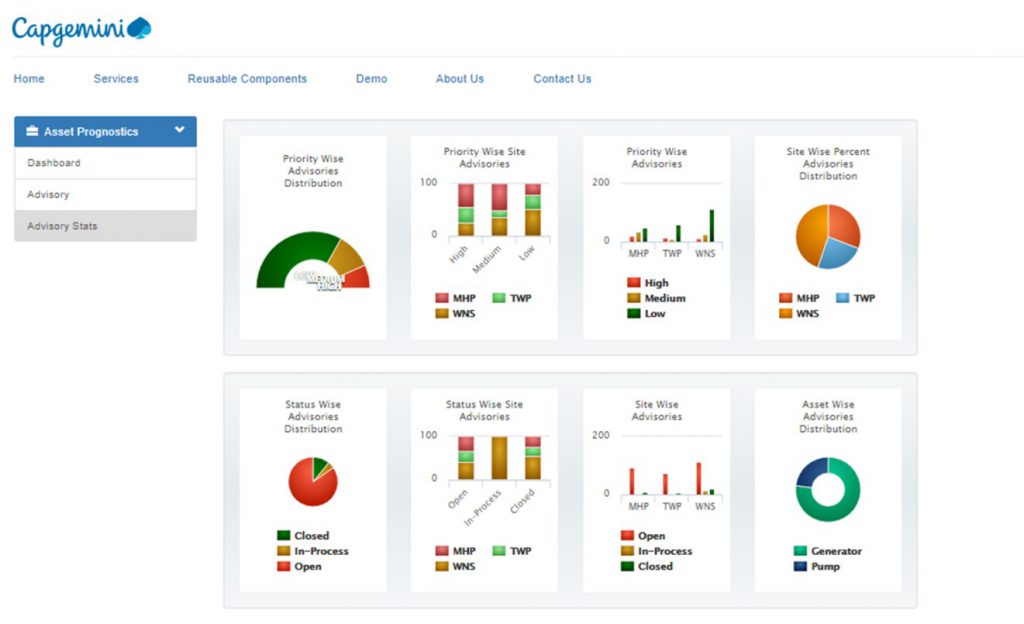
PredictEAP Dashboards showing Advisory Statistics
The analytics dashboard shows various views based on diagnostics advisory. The advisory page provides options to select and filter advisories based on site, category, asset type, priority, and date range. The advisory statistics page (shown above) displays a spectrum of graphs to provide details on advisory based statistics, like site-wise advisory details, priority-wise site advisories, and so on. Our framework supports tools like Microsoft PowerBI and Tableau for visualization of live dashboards and interactive reports.
For more
information, please contact: engineeringanalytics.in@capgemini.com
About the author