 English | EN
 MY DOCTOR WON’T USE MY HEALTH DATA!
January 9, 2023

I am obviously ill, just look at my data
I was unfortunate to have a serious injury recently. An accident on my mountain bike. I realise now that I should know better and I am badly trying to impress my kids doing things that weekend warriors should stay away from. I had ruptured a disc in my spine and the disc was pressed against a nerve right beside my spinal cord.

I am keen on sports and I work with data as part of my job, so I like to track all of my activities. I wear a Garmin watch which constantly measures my health vital statistics, like Heart Rate, Heart Rate Variability, Stress, Pulse Ox and energy availability (Garmin Body Battery), among other things. Initially, because I was not doing any sport, I was not paying attention to the data but after some time a trend became obvious.
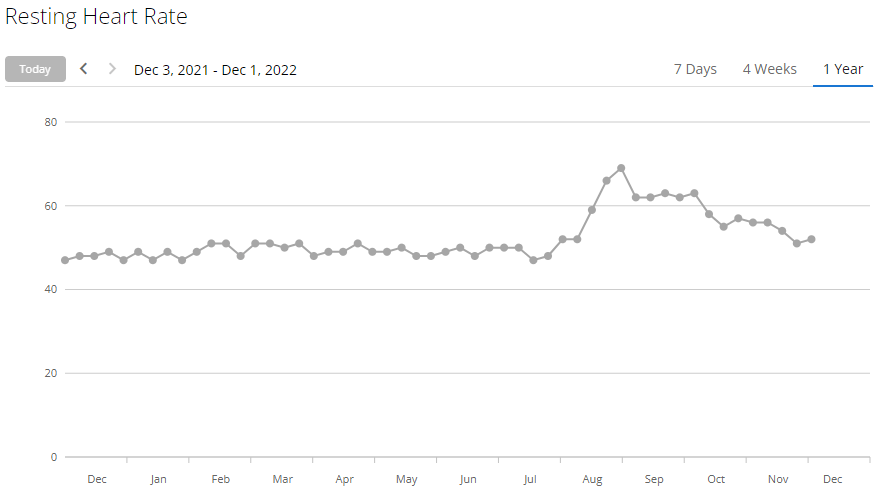
For example, my resting heart was consistently below 50 before the accident. When you see the graph below, you won’t get a prize for working out when I was injured. My resting heart rate went to 70.
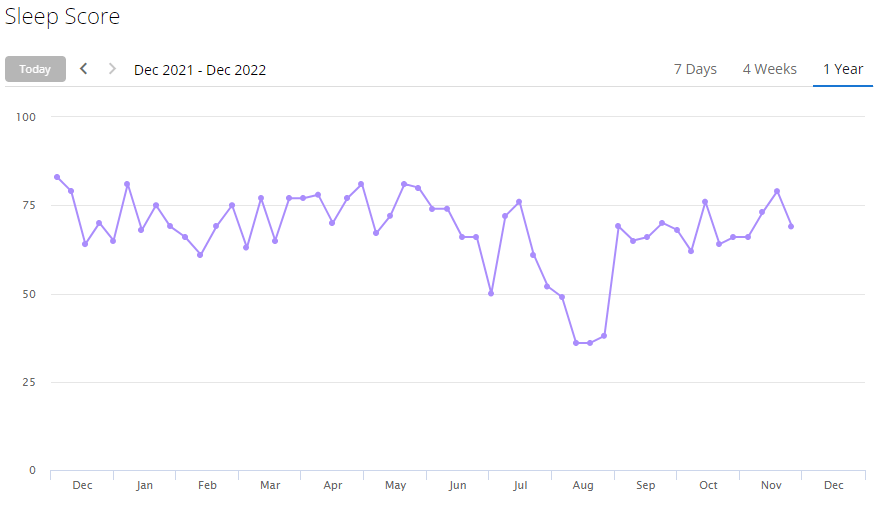
Here is my sleep score across the year:
And Stress:
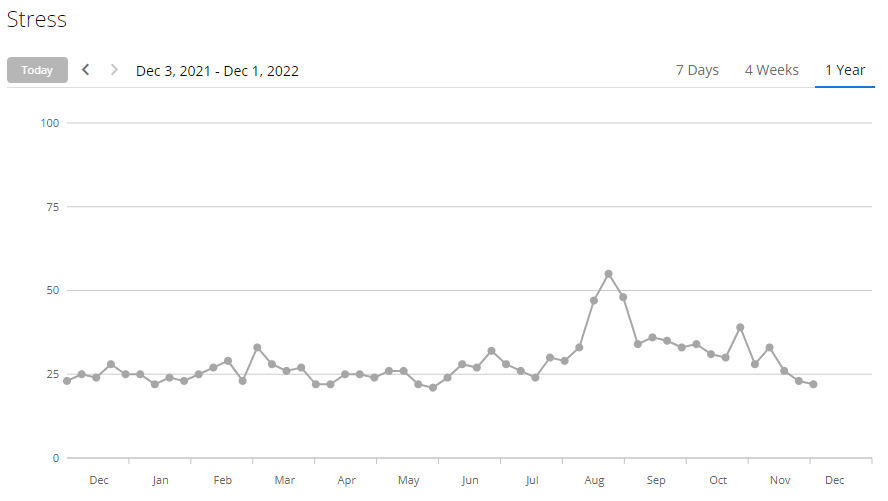
Same with all of the other measures. All of my vital health stats changed.
I was working with a physio and doctor for my injury and mentioned that I had this data. For a lot of the health stats, Garmin say that they depend on the autonomic nervous system and I had a nerve issue. So I though it might provide some information into my condition. Both the doctor and physio said “that’s interesting isn’t it” but dismissed it quickly.
I’ve seen this problem before
I was totally confused but realised that it was not the only time I had been in this situation. In my work, I often come across professionals, of all types, who don’t care about data and reports. They seem disinterested. So I questioned the doctor and physio during my next visit and their answer was clear. “I don’t know what their algorithm is”. They understood that the graph was saying something but because they didn’t have the information behind the graph, they could not use it. Even if they used it, they could not trust it. And even if they trusted it, they usually don’t see the value. It’s the same in my job with people who don’t normally use data, don’t know what they are looking at. So they won’t use it as a trusted source of information or they don’t see the value.
Can we do something better?
We need to help people trust and see the value in information. Trust is hard to win.
- Be transparent (part 1). If you are showing information to anybody, in a report or Excel, show how you derived information from that data. Show the calculation or algorithm. A lot of big organisations find this difficult and spend lots of people power solving the problem. Just look at reporting standards in the banking industry. If you do transparency well, you have an advantage over a lot of your market competitors.
- Be transparent (part 2). Not only should you show calculations and algorithms, show your data sources. Information is only as good as the under-lining data.
- Use a standard. Many organisations are trying to highlight their green and sustainable credentials. To do that, they follow a reporting standard. This provides them with the definitions and KPIs that they need to highlight how they achieve their green ways of working. Industry standards also help their credibility in the area because they are standards which are transparent, results are comparable to other results and people can easily find out more about these standards.
You might ask how that affects your smaller organisation with internal reports? Does every part of your organisation have the same definition for key terms? Do you all calculate KPI’s in the same way? Do you all have the same KPI’s? Implement a Data Governance program to help solve this problem.
- Involve the users. If the users are part of the creation and design of the solution, they will have more trust in the output and will understand the data better. They will also provide input into what the information should be telling the user, which will drive the value of the information.
- Data visualisation. How are you going to tell a story which people understand? Data Visualisation is the most under-rated skill and underrated part of the process. There are many, many books written on the topic of data visualisation and when done well, it will make a huge difference to the perceived value of the information.
So, what about my health data?
Most tech companies, like Garmin and Apple don’t follow the suggestions above. They might follow a standard for reporting data but how they come to their conclusions are far from transparent. For example, Garmin mention that some of their metrics are “provided and supported by Firstbeat® Technologies, Ltd.” without providing much more info. Even if my doctors know about Apple, they might not know Garmin, Google, etc… So my doctors are unlikely to know about all of these platforms, so will dismiss them all.
About the author