 English | EN
Almost everyone is familiar with Sherlock Holmes, the legendary fictional detective best known for his famous quote: “Elementary, my dear Watson” [1]. He is also well-known for his uncanny ability to solve mysteries. Written by Sir Arthur Conan Doyle and adapted for the stage, television, and movies many times.
Imagine London in the 19th century at night. There is a heavy fog over the city and you can barely make out the time on the Big Ben in the distance. The perfect setting for a Sherlockian mystery.
What does all of this have to do with the technology you might ask. With modern application landscapes and the number of moving parts, our production environments will often resemble a foggy London at night. The perfect setting for things to go wrong and to plunge you into your very own mystery.
So how would Sherlock do it? Based on his powers of observation and deductive reasoning he would follow the evidence to find the culprit. But how do we get this evidence in our landscapes? Elementary, our applications need to start leaving evidence if we are to follow the trail.
Three pillars of Observability
This is where Observability comes into play. Observability is the manner in which our applications are capable of being observed. To put it simply: the amount and type of evidence our applications and components leave to be investigated.
There are three pillars that make up the main body of observability, those being:
- Logs – Something happened at a certain point in time
- Metrics – Metrics consist of gauges (think of a fuel gauge), counters and timers (how long did something take)
- Traces – Following the path through our code and across services to we can follow along through Context Propagation
Explaining those three pillars in depth is beyond the scope of this article.
Piercing the fog
When you start adding observability to your applications you will at first create a lot of chaos. Where do I get the logs? Where are the metrics coming from? And what about traces?
To solve the chaos we need to start aggregating all the different sources and put them into centralized storage. These storages are optimized for their respective type, those being logs, metrics, and traces.
This however creates a new problem. With all the evidence combined, you will be overwhelmed by the sheer amount of data that you will have to dig through to make sense of what is happening. To come back to our fog analogy, we have made the fog even harder to pierce.
So how do we solve this conundrum? To begin we add metadata to our logs, metrics and traces. It would be very helpful to add the application name, hostname, datacenter and possibly a user ID to some of the sources.
Now that we have this metadata in place we can start correlating logs, metrics and traces. It can be on common fields, time periods or a combination of the two. This will reduce the sheer amount of data that you need to process.
Last but not least, making sense of the raw data is very hard. We as humans are far better with pictures, graphs and maps. So the final step in completing the journey is visualization. making dashboards and overviews of what is important.
The Observability Pipeline
Combining all of the above is something that is called the Observability Pipeline. A simplified schematic is shown in the picture below.
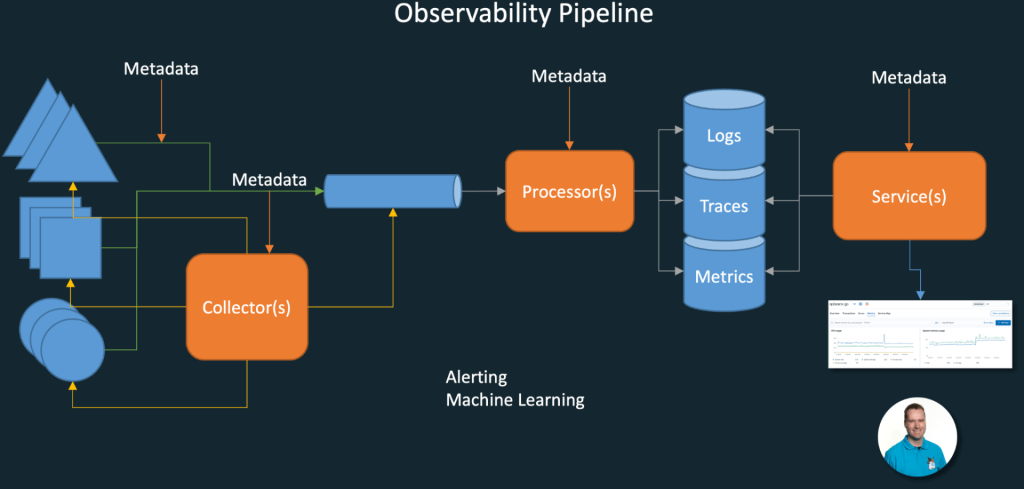
On the left, there are the different sources of data either pushing data into the pipeline directly or being queried periodically for their data. In the pipeline, the data is processed by one or more processors, such as transformation and normalization. The data is then stored in optimized stores so that it can be queried to create visualizations for a user to view. Metadata can be added at several locations to improve the dataset.
Optionally Machine Learning can be applied on the dataset for trend analysis and predicting problems. And when certain thresholds are reached alerts can be sent out.
Elementary my dear Watson
By implementing Cloud-Native Observability, you and your team can become more like Sherlock Holmes and improve your Mean Time Till Detection and Mean Time Till Repair. You will be saying “Elementary” a lot more.
[1] Sherlock actually never utters the phrase “Elementary my dear Watson” in over 60 stories produced.