 English | EN
This blog is a summary of how overall observability (metrics, alerting, and log aggregation) will work in Azure Kubernetes Service (AKS) for any modern containerized application.
In traditional, host-centric infrastructure, only two main layers need to be monitored, applications and the hosts running them. Containers have added a new layer of abstraction between the host and applications.
Now Kubernetes, which orchestrates all containers, also needs to be monitored to comprehensively track overall infrastructure. That makes five different components that need to be monitored, each with their specificities and challenges:
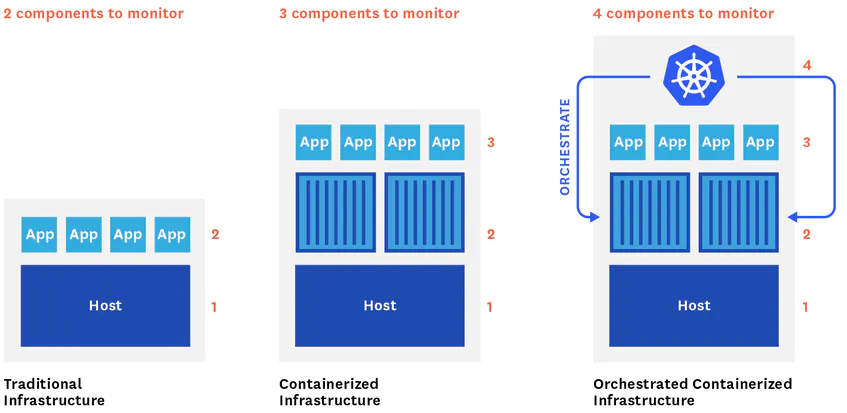
- Nodes – where containers and applications are running.
- Containers – where applications are running.
- Application – actual applications and its behaviour.
- The Kubernetes cluster – all components of Kubernetes like API server, Controller Manager, Scheduler and etcd.
- Service discovery – detect any change in the inventory of running pods and automatically re-configure the data collection so it can be continuously monitored containerized workloads even as they expand, contract, or shift across hosts.
The following are different type of alert and monitoring metrics for AKS:
Cluster State Metrics
Alert | Node status:
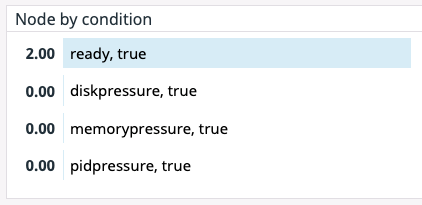
This cluster state metric provides a high-level overview of a node’s health and whether the scheduler can place pods on that node. It runs checks on the following node conditions:
- OutOfDisk
- Ready (node is ready to accept pods)
- Memory Pressure (node memory is too low)
- PID Pressure (too many running processes)
- Disk Pressure (remaining disk capacity is too low)
- Network Unavailable
Alert | Desired vs. current pods:
This monitoring gives bottlenecks, such as nodes lacking the resource capacity to schedule new pods. It could also indicate a problem with the configuration that is causing pods to fail. In either case, inspecting pod logs can provide insight into the cause. This is the important alert to be monitored by operation team.
Monitoring | Available and unavailable pods:
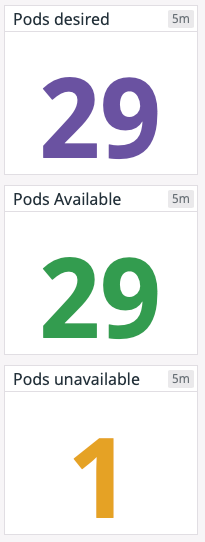
A pod may be running but not available, meaning it is not ready and able to accept traffic. This is normal during certain circumstances, such as when a pod is newly launched or when a change is made and deployed to the specification of that pod. But if you see spikes in the number of unavailable pods or pods that are consistently unavailable, it might indicate a problem with their configuration. Important metrics to be monitored if expected number of services is up and running.
Resource Metrics
Alert | Memory limits per pod vs. memory utilization per pod:
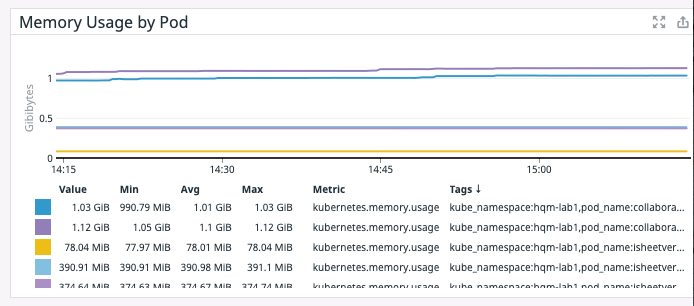
When specified, a memory limit represents the maximum amount of memory a node will allocate to a container. If a limit is not provided in the manifest and there is not an overall configured default, a pod could use the entirety of a node’s available memory. Note that a node can be oversubscribed, meaning that the sum of the limits for all pods running on a node might be greater than that node’s total allocatable memory. This requires that the pods’ defined requests are below the limit. The node’s kubelet will reduce resource allocation to individual pods if they use more than they request so long as that allocation at least meets their requests. Metrics to be monitored by operation and engineering teams to understand the memory requirements of the application.
Alert | Memory utilization:
Keeping an eye on memory usage at the pod and node level can provide important insight into your cluster’s performance and ability to successfully run workloads. Metrics to be monitored by engineering teams to understand the memory requirement of the application.
Alert | Capacity Planning: Disk utilization
Like memory, disk space is a non-compressible resource, so if a kubelet detects low disk space on its root volume, it can cause problems with scheduling pods. If a node’s remaining disk capacity crosses a certain resource threshold, it will get flagged as under disk pressure. Important metrics for disk capacity planning.
Monitoring | Capacity Planning: Memory requests per node vs. allocatable memory per node
Although memory capacity is a static value, maintaining an awareness of the sum of pod memory requests on each node, versus each node’s allocatable memory, is important for capacity planning. These metrics will inform you if your nodes have enough capacity to meet the memory requirements of all current pods and whether the Control Plane can schedule new ones. These metrics are useful for operation and engineering team. This is one useful metric for capacity planning.
Monitoring | CPU limits per pod vs. CPU utilization per pod
These metrics let you track the maximum amount of CPU a node will allocate to a pod compared to how much CPU it’s using. Unlike memory, the CPU is a compressible resource. This means that if a pod’s CPU usage exceeds its defined limit, the node will throttle the amount of CPU available to that pod but allow it to continue running. This throttling can lead to performance issues, so even if your pods won’t be terminated, keeping an eye on these metrics will help you determine if your limits are configured properly based on the pods’ actual CPU needs.
Application Metrics
JVM Metrics
- Alert: on heap memory utilization more than 70%
- Metrics: Statistics related to garbage collection
- Metrics: Threads utilization
- Metrics: Number of classes loaded/unloaded
CPU Metrics
- Alert: CPU metrics & utilization more than 70%
Log Metrics
- Monitoring: Logback metrics: record the number of events logged to Logback at each level
- Alert: Logback error count increases
Tomcat & Uptime Metrics
- Monitoring: Uptime metrics: report a gauge for uptime and a fixed gauge representing the application’s absolute start time
- Monitoring: Tomcat metrics (server.tomcat.mbeanregistry.enabled must be set to true for all Tomcat metrics to be registered)
Control Plane Metrics
(The Control Plane is managed by Microsoft and may not have access to all the components and metrics)
Alert | etcd_server_has_leader
Except during leader election events, the etcd cluster should always have a leader, which is necessary for the operation of the key-value store. If a particular member of an etcd cluster reports a value of 0 for etcd_server_has_leader (perhaps due to network issues), that member of the cluster does not recognize a leader and is unable to serve queries.
Monitoring | etcd_server_leader_changes_seen_total
The metric etcd_server_leader_changes_seen_total tracks the number of leader transitions within the cluster. Frequent leader changes, though not necessarily damaging on their own, can alert you to issues with connectivity or resource limitations in the etcd cluster.
Monitoring | apiserver_request_latencies_count and apiserver_request_latencies_sum
Kubernetes provides metrics on the number and duration of requests to the API server for each combination of resource (e.g., pods, Deployments) and verb (e.g., GET, LIST, POST, DELETE). By dividing the summed latency for a specific type of request by the number of requests of that type, you can compute a per-request average latency.