English | EN
Introduction
Analyzing stock returns and volatility is crucial for making informed investment decisions. By leveraging Python, you can unlock powerful capabilities to analyze historical stock data, calculate returns, and measure volatility. In this comprehensive guide, we’ll explore various techniques using Python.
1. Importing the Required Libraries
Before we begin, let’s import the necessary libraries:
- pandas: For data manipulation and analysis
- numpy: For numerical computations
- yfinance: For fetching historical stock data
- matplotlib: For data visualization
You can install these libraries using the following commands:
pip install pandas numpy yfinance matplotlib
2. Retrieving Historical Stock Data
To analyze stock returns and volatility, we need historical stock price data. We’ll use the yfinance library to fetch data from Yahoo Finance. For example, let’s retrieve historical data for Apple Inc. (AAPL) from January 1, 2018, to December 31, 2022:
import yfinance as yf

symbol = 'AAPL'
start_date = '2018-01-01'
end_date = '2022-12-31'

stock_data = yf.download(symbol, start=start_date, end=end_date)
The stock_data DataFrame contains Open, High, Low, Close, Volume, and Adjusted Close prices for each trading day.
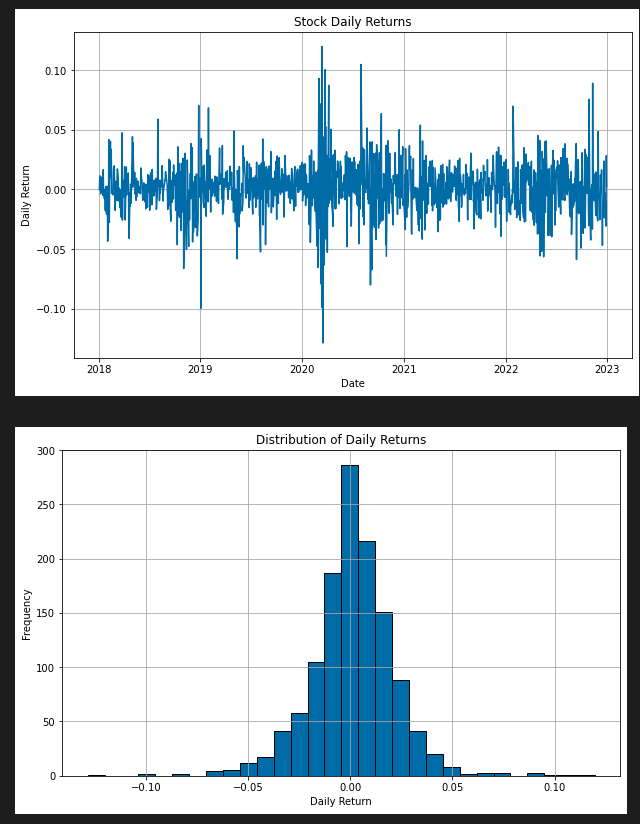
3. Calculating Daily Returns
Daily returns help us understand how a stock’s price changes day-to-day. We calculate daily returns using the formula:
Daily Return= (Price Today−Price Yesterday) / Price Yesterday
Let’s calculate and visualize the daily returns:
# Calculate daily returns
stock_data['Daily Return'] = stock_data['Adj Close'].pct_change()

# Line chart for daily returns
plt.figure(figsize=(10, 6))
plt.plot(stock_data.index, stock_data['Daily Return'])
plt.title('Stock Daily Returns')
plt.xlabel('Date')
plt.ylabel('Daily Return')
plt.grid(True)
plt.show()

# Histogram of returns
plt.figure(figsize=(10, 6))
plt.hist(stock_data['Daily Return'], bins=30, edgecolor='black')
plt.title('Distribution of Daily Returns')
plt.xlabel('Daily Return')
plt.ylabel('Frequency')
plt.grid(True)
plt.show()
4. Analyzing Stock Volatility
Volatility measures how much a stock’s price fluctuates. You can calculate volatility using standard deviation or other statistical methods.