 English | EN
Add vision to your RAG system
Disclaimer: This series explores concepts and creative solutions for building Advanced Retrieval Augmented Generation (RAG) Systems. If you’re new to RAG systems, I recommend exploring some introductory materials first. Microsoft’s Introduction to RAG in AI development and Google Cloud’s free course on Retrieval Augmented Generation are good places to start.
Welcome back to my series on building advanced RAG systems! In the previous post, I explored how to move beyond basic document loading and text splitting. If you haven’t read the first part 1, I recommend starting there as I will be building on those concepts in this and future blogs. For part 2 of this series, I will be tackling another important and sometimes overlooked aspect of document ingestion – handling visual elements like images, tables, flow charts, diagrams, and graphs.
The invisible problem
An important detail often overlooked in RAG implementation tutorials is the handling of images and other visual (or non-text-based) elements. When using popular frameworks like Langchain, document loaders and text splitters typically discard images, diagrams, and other visual content by default. This is because these tools don’t have a native way to process visual elements. An unfortunate consequence of this is that some developers are unaware that they need to process visual data separately. This leads to the development of RAG implementations that essentially throw the visual content in the garbage each time they load a new document. By omitting visual data, we lose valuable information.
Modern solutions with vision models
The development of multimodal “Vision” models has removed the text-only constraint. While true multimodal embedding systems are still in the experimental phase, we have access to powerful vision models that can bridge this gap.
Two notable options are:
- Mistral AI’s Pixtral
- OpenAI’s GPT-4
These models can accept an image as input and generate text about it. When provided with well-crafted instruction prompts vision models excel at generating detailed textual descriptions of visual content. This includes identifying text content in the image itself as well as positional information. This capability opens up a lot of possibilities for preserving visual information in our RAG systems.
Different approaches for different visual elements
I find that different types of visuals benefit from different ingestion approaches:
Images
For standard images, the straightforward approach works well:
- Extract images from your documents.
- Feed them through your chosen vision model.
- Generate detailed descriptions for each image.
- Insert the text descriptions in place of the images when generating vector embeddings for the document.
The key here is crafting good prompts for your vision model. You want descriptions that capture not just what’s in the image, but its context and purpose within the document. Providing the vision model with some surrounding text or the image caption text can also improve the results.
Flow charts and diagrams
Here’s where things get interesting. While you could use the basic image-to-text description approach, I’ve found a more powerful alternative, convert these elements into Markdown Mermaid format. This approach has several advantages:
- It preserves the structure and relationships shown in the diagram or chart.
- It creates a text version that modern LLMs can work with and reason about.
- It enables the LLM to potentially modify or extend the diagram when needed.
- It maintains the visual information in a format that can be re-rendered.
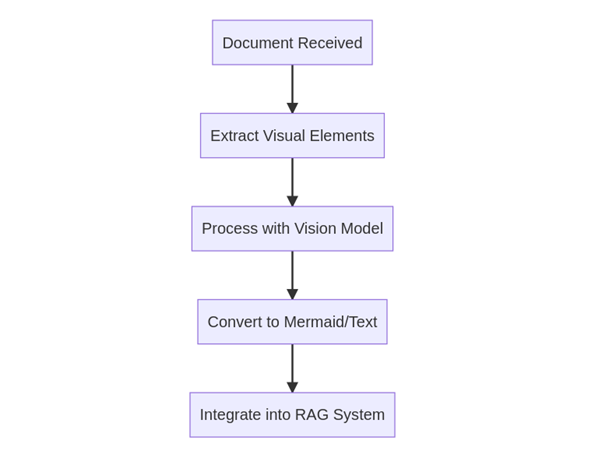
Here’s a simple example of a basic flow chart represented in Mermaid format:
graph TD
A[Document Received] –> B[Extract Visual Elements]
B –> C[Process with Vision Model]
C –> D[Convert to Mermaid/Text]
D –> E[Integrate into RAG System]
This is what it looks like when rendered:
Graphs and charts
For data visualizations, I recommend a hybrid approach:
- Use a vision model to extract the key data points and trends.
- Preserve any actual numerical data in a structured format (like a Markdown table).
- Include a textual description of the main insights or conclusions from the vision model.
This ensures you’re preserving the visual appearance and the underlying data. Pie charts, histograms and several other graph types can be converted to Mermaid or other code-based formats like the approach used for flow charts and diagrams.
Implementation tips
When implementing these approaches, keep in mind:
- Batch processing: Vision model calls can be expensive and time-consuming. Batch your image processing when possible.
- Quality control: Randomly sample and review the generated descriptions. Vision models can sometimes miss subtle details or misinterpret complex diagrams.
- Context preservation: Ensure your system maintains the relationship between visual elements and their surrounding text. An image or diagram’s meaning often depends heavily on its context.
- Fallback options: Have a simple text description pipeline as a fallback for cases where more sophisticated conversion methods fail.
Performance considerations
While adding vision model processing to your RAG pipeline does increase computational overhead and processing time, the benefits often outweigh the costs. In my experience, the improved comprehension and response quality from including visual information makes the investment worthwhile. This is especially true in technical or educational contexts where visuals are often used to convey complex information.
Looking ahead
In the next post, I’ll explore another powerful technique for enhancing RAG systems document summarization. We’ll look at how these elements can provide context that might otherwise be lost in the document retrieval process.