THIS PIECE OF DATA IS LYING! (2/2)
September 26, 2014
 In the first part, some strange conclusions appeared to be drawn from data. Let’s try to explain what happened.
Folding/Aliasing
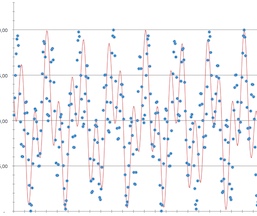
We analyzed a sequence of data (people entering a mall, measured every 7 minutes during the day for a month) that we assumed to be periodic. So we “converted” our data from time to frequency to identify the rush periods (and we “converted” it back to check how close we were).more–>
What we forgot in the process was that our sample rate (fs=once every 7 minutes, 2.38mHz, as it is “slow” we have to use milliHertz units) didn’t permit us to “find” anything with a frequency higher than fs/2 (1.19mHz in our case, something happening more than once in 14 minutes). A key aspect in converting information from the time domain to the frequency domain is that you need at least two data points influenced by a frequency in you observation period to be able to measure it.
“But we didn’t do anything wrong!” would anybody say, as we found 45 minutes (0.37mHz) and 17 minutes (0.99mHz) which are both below fs/2 (1.19mHz). Yes, but we didn’t “clean” the data before applying our transformation tool. And there was something (the main subway, up to 10 people every 12 minutes, 1.39mHz) hiding in our data. The 45 minutes was real (it’s the train frequency), but the 17 minutes wasn’t at all. It appeared, as a ghost, in the mirror of the Nyquist frequency (fs/2) due to “folding” (like folding a paper on a line at fs/2).
This folding is the first reason to always be careful in finding frequencies in measurements of phenomenon that can have variations above half the frequency rate. One way to do this is to increase the sampling frequency, here the same mall example with a one-minute sampling rate (still showing the estimation for comparison)

But it’s not that easy when you don’t know how “high” in frequencies reality can go, so applying a low-pass filter is usually the way to go, remembering that low-pass filters are not “vertical” and induce other artifacts (the stronger the filter, the more the phase is altered; some residue often remains if there are strong high frequency information and they should be cancelled out by generated added noise beforehand).
In more common-life experience, when you see a wheel rotating backward in a movie, or when you find a CD from an old mastering harsh, you will now know where it comes from (aliasing for the wheel and steep low-pass filters, low to no noise added beforehand plus sometimes residue of folding).
Regression to the mean
For the strange services performance improvement (and deterioration) of services comparing the best/worst performing groups in two successive tests (as in fact we discovered we did nothing between the two campaigns to improve or worsen their performance), I’ll let Derek Muller from Veritasium give you some explanation and examples.
The main point here is to always be careful comparing an oriented subset of measures (because the reason of the selection can often impact the comparison), always check the population of measures (is it already an oriented subset?) and the effect of the measure on the data (am I measuring the tool or the phenomenon?). Another good practice is to keep an open mind and try to evaluate other hypotheses as well (because our main line of analysis is often convergent with the result we would like to observe).
Or you can use this in future career moves…
Conclusion
With data becoming easier to acquire, tools easier to use, quantities easier to overwhelm, use the tools you know well, keep an open mind on your hypothesis, and always ask a specialist when dealing with complex analysis and high stake results.

 English | EN